
Multifamily unit visualization software turns a property's floor plans, site map and live availability into an interactive map that prospects can explore online. They can click a floor, filter by beds or price, and see what's available in real time.
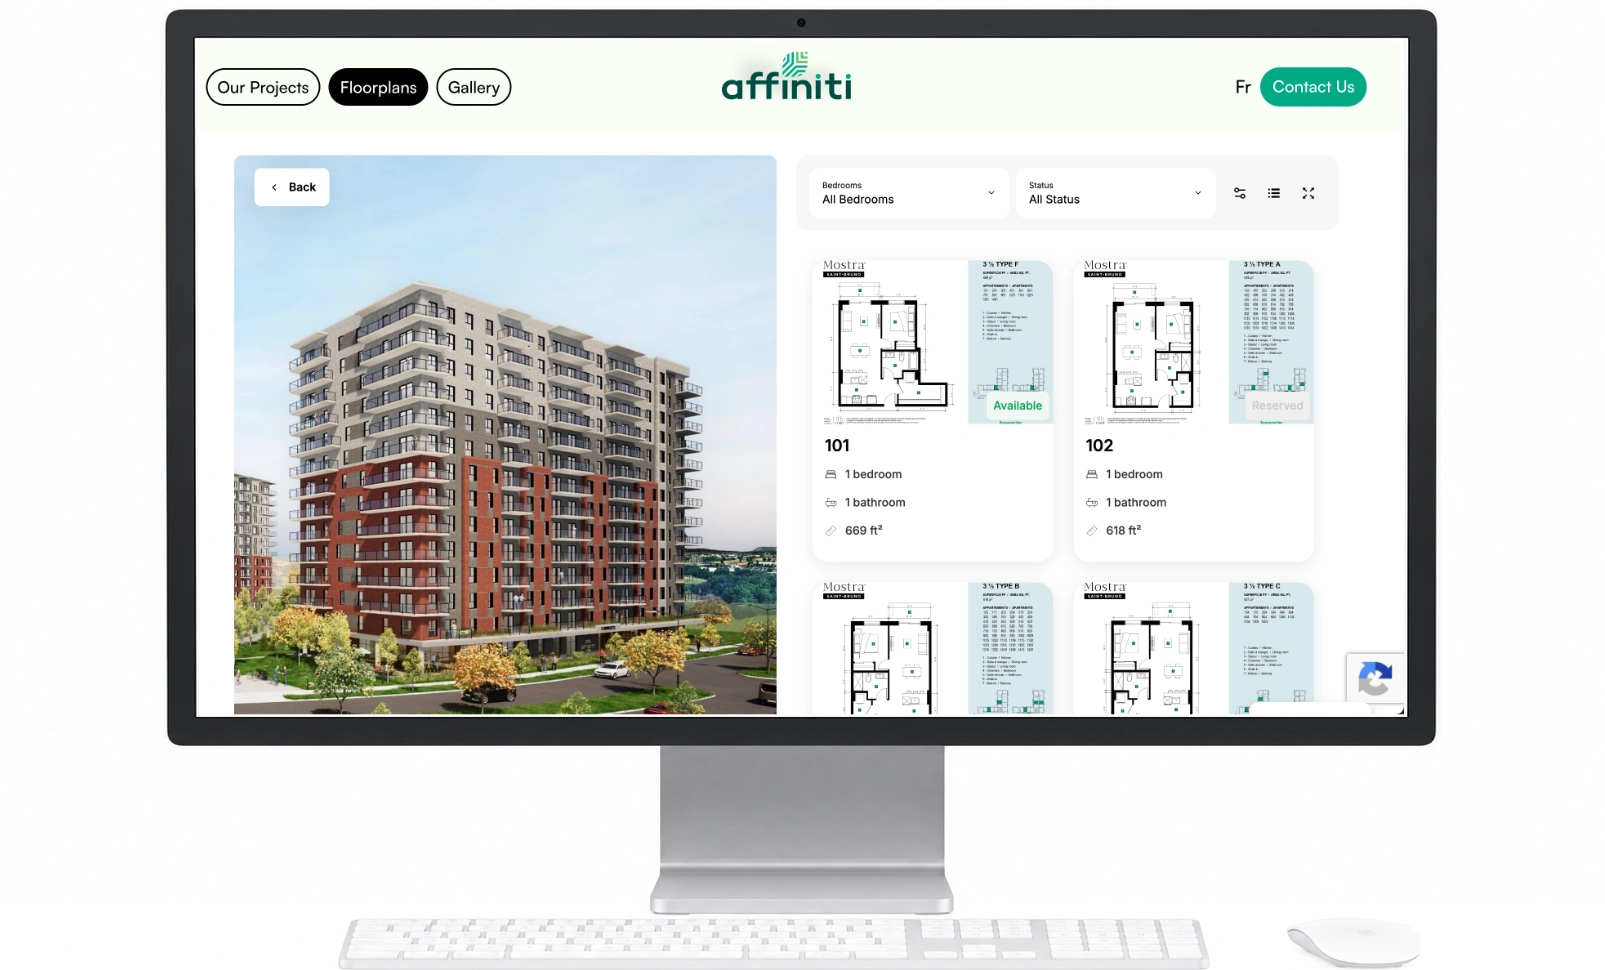
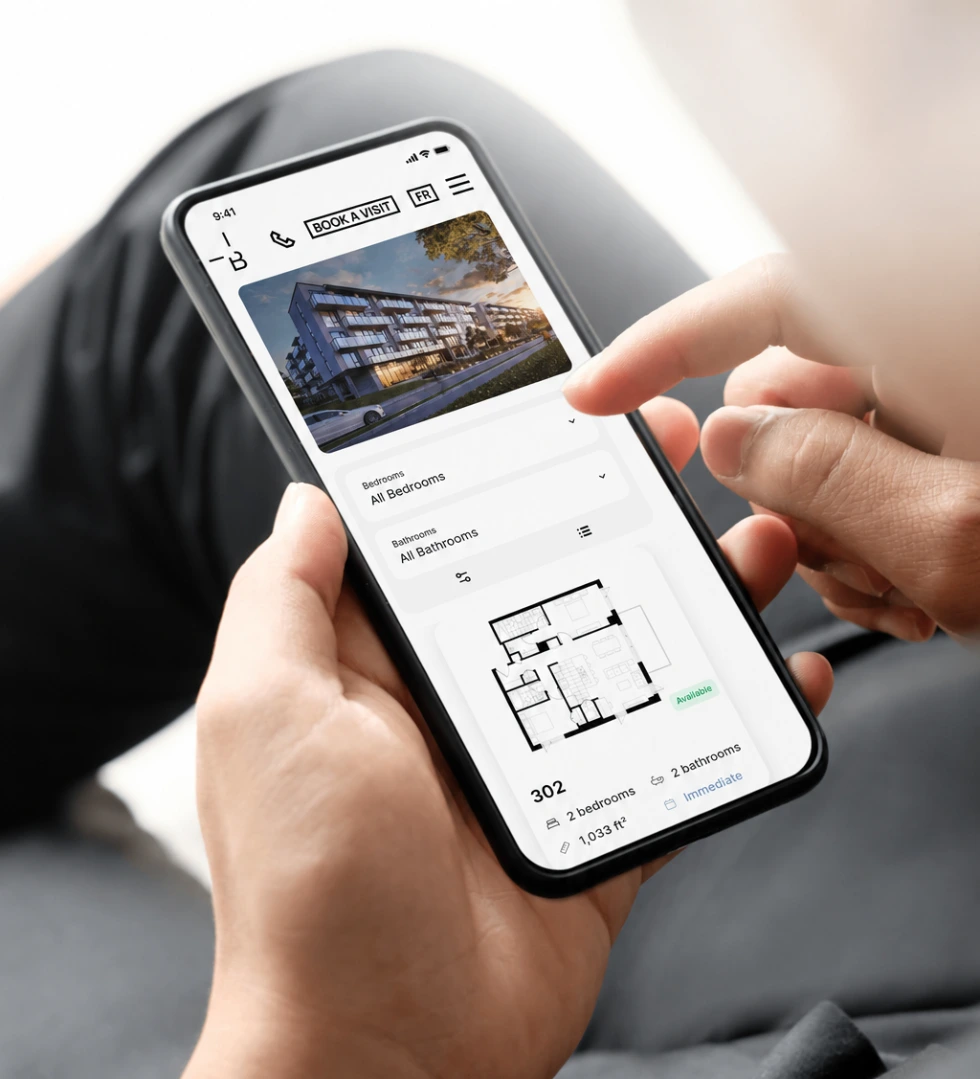
Multifamily unit visualization software displays a property's units as an interactive, filterable map instead of a static floor plan or PDF. The map shows floors, layouts, availability and pricing. Prospects explore the building online. They can click a floor, compare units, filter by bedrooms, price or availability, and book a tour on the units they want.
A static site plan makes a prospect email your leasing office to ask "what's available?" An interactive unit map answers that on the page, instantly, and captures the lead while intent is highest.
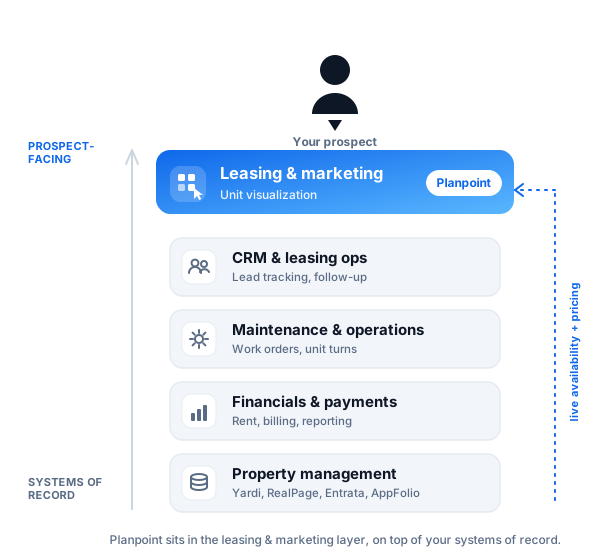
Multifamily proptech is a broad category: property management systems, leasing and marketing, financials, maintenance and workflow automation. Most operators now run several platforms, and each one handles a different part of the resident lifecycle.
Unit visualization belongs to the leasing and marketing layer, the prospect-facing part of your stack. It doesn't replace your PMS (Yardi, RealPage, Entrata, AppFolio) or your CRM. It sits on top of them. Your systems hold the source-of-truth availability and pricing, and your visualization tool turns that data into something a prospect can see and click on your website..
It's one of the highest-ROI pieces in the stack because it's the part prospects actually touch. Everything else optimizes what happens after someone applies. Visualization optimizes whether they apply at all.
Each feature below answers a question your leasing team usually gets by email.

Prospects jump straight to the floor or tower they care about.
Every unit is colour-coded as available or leased, and updates in real time.
Prospects filter by beds, bathrooms, price and square footage, and the UI narrows to the units that fit.
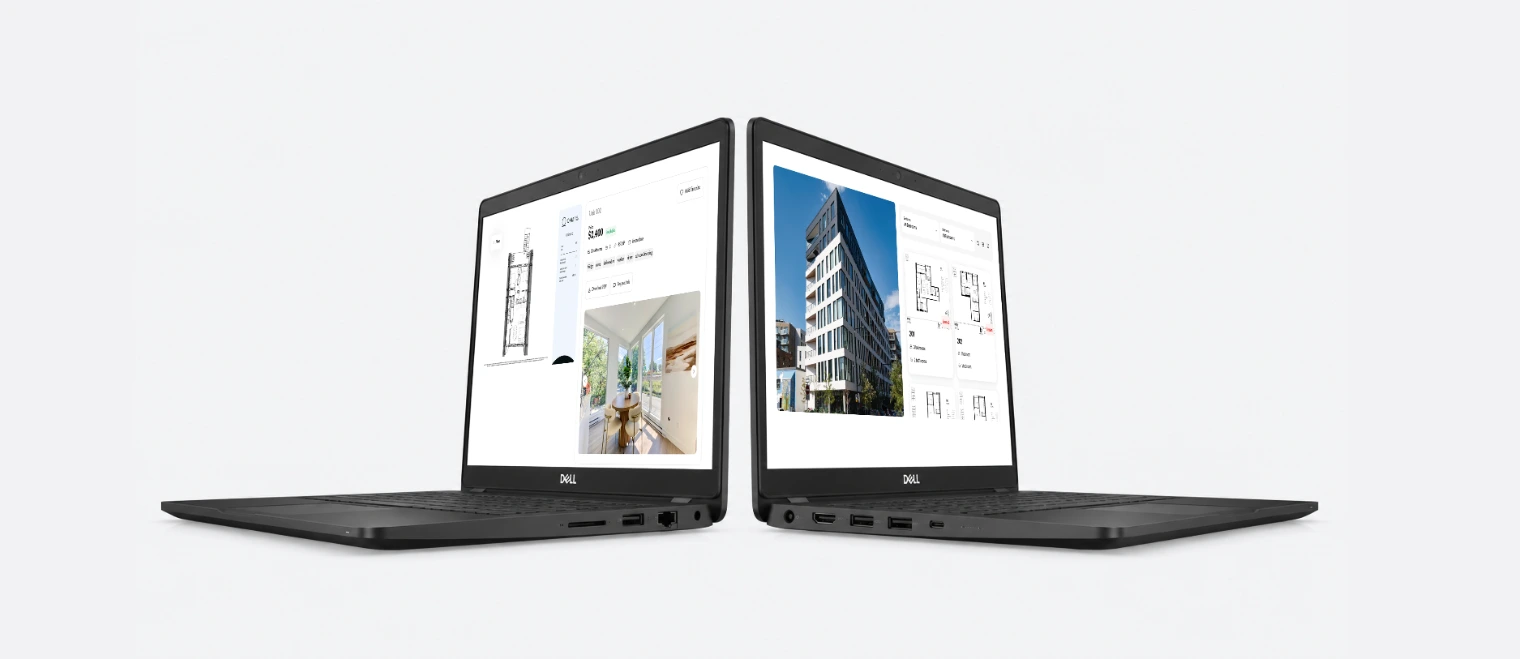
Each unit shows its plan, price, features, gallery and 3D tour without leaving.
The number a prospect sees is the number your team set five minutes ago.
Prospects book a tour while they're still on the page, and the lead goes straight to your CRM.
You can show the same building five different ways. Choose the one that fits the property and where people will see it.
A clean, fast, interactive 2D plan. It's the everyday mode for leasing, and the one that makes Planpoint affordable for any building.
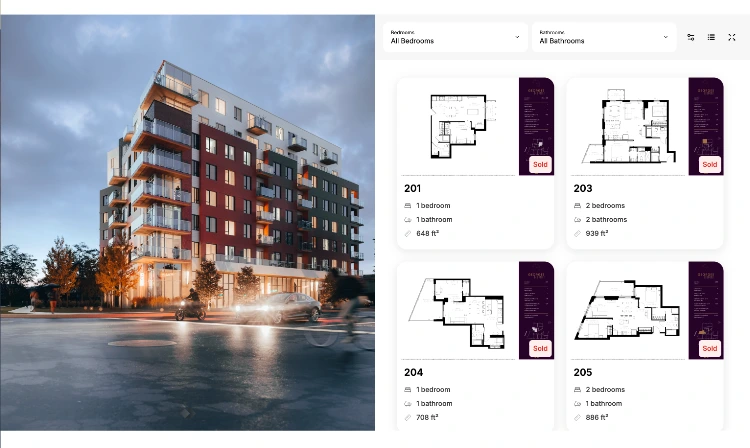
A panoramic view of the project and its surroundings. Use it to sell the location, the views and the neighbourhood along with the unit.
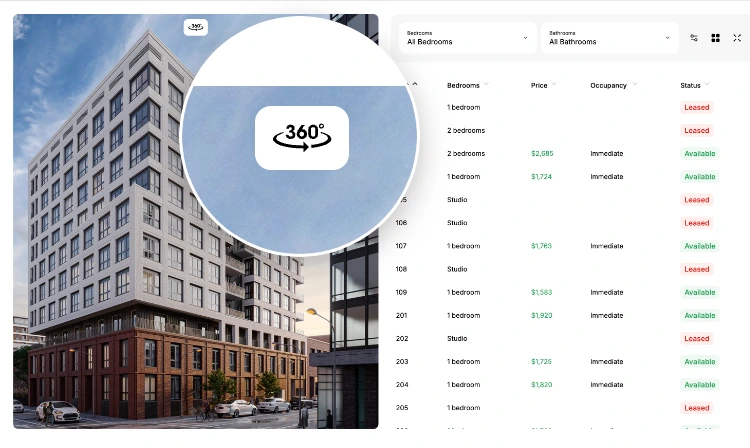
Pin units, parking and nearby points of interest, the details that close the lifestyle sale.
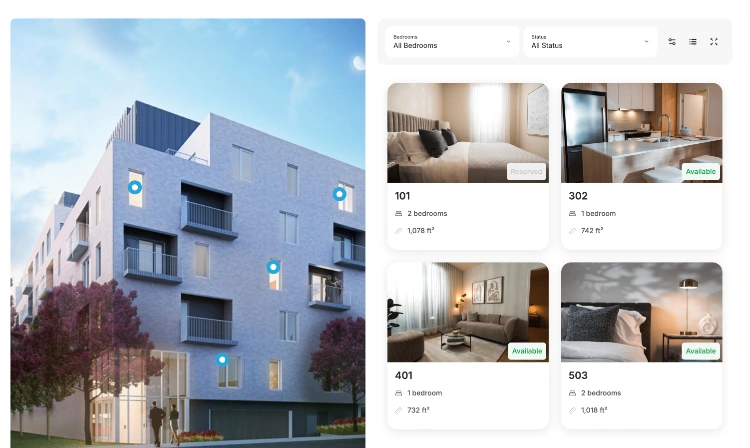
A touchscreen presentation mode for TVs and tablets, built for the leasing office. It's free.
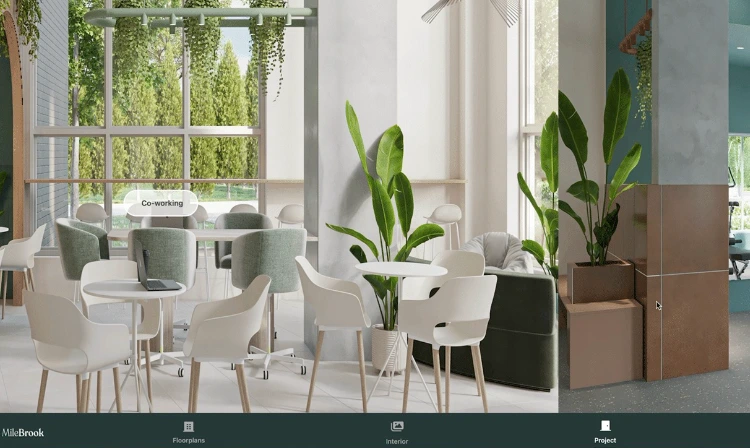
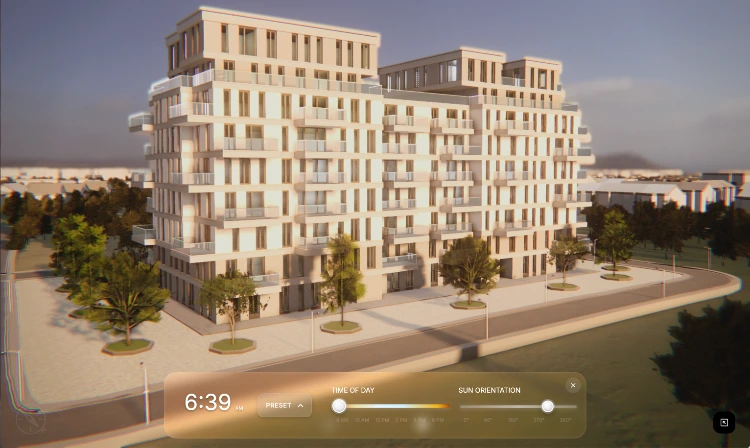
A photoreal 3D building that prospects can move through, rendered in real time with WebGPU. It's built for signature and luxury lease-ups.
Reading about an interactive map is nothing like clicking through one. Try the real Planpoint Viewer below. Filter units, open a floor and check availability. This is what multifamily unit visualization software looks like in practice, and exactly what your prospects would use.
Apartment hunting has moved online, and digital leasing is now one of the clearest trends in multifamily proptech. The question is whether your leasing page has kept up.

~65% of residents prefer digital leasing over traditional paperwork.
~64% already use, or plan to adopt, virtual leasing offices.
~78% of property managers say digital transformation improves operational efficiency.
Prospects now browse, compare and shortlist buildings on their own before they ever call. If your building shows up as a static PDF while the property down the street shows a live, filterable unit map, you've lost the comparison before the tour. That's why multifamily unit visualization software has gone from a nice extra to something renters expect.
Every day a unit sits empty is rent you don't get back, so faster leasing means real money. Use the calculator to see what your current vacancy costs you, and how much you'd save by cutting even a few days from your leasing cycle.
Renderings are static. They go out of date the moment a unit leases, and you pay again to update them. A unit map is interactive and stays current because it reads live availability from your systems.
It's an embed. You build your map in the online editor and paste one snippet into your leasing site, whether it runs on WordPress, Webflow, Squarespace or a custom build. You don't need a developer or a migration.
It does, but only inside your PMS, where prospects never see it. Unit visualization software takes the same data and puts it on your public leasing page, where renters make their decision.
Planpoint is hosted and loads as a lightweight embed, so it doesn't add server load the way a heavy plugin would. Your page speed and search rankings stay protected.
No. Base mode makes an interactive stacking plan affordable for a single building, and pricing scales with the number of units you're actively marketing.
Connect Planpoint to your proptech software, your CRM and, through Zapier, more than 6,000 other apps.

Sync live availability and pricing straight from Yardi, so your multifamily Viewer always shows what's leasable today. Change a unit in Yardi and the map updates.

Every lead a prospect creates on the map flows into Salesforce with the unit they picked attached, so your team follows up while interest is still hot.

Send Viewer leads into HubSpot and let your workflows handle the rest, such as instant replies or nurture sequences that keep prospects moving toward a lease.

Zapier links your unit map to more than 6,000 other apps, so a new lead or tour booking can trigger almost anything in your stack, with no code required.

"We build and lease a lot of units, and the first thing a prospect wants to know is simple: what is available, and what does it cost. Planpoint answers that instantly. We put an interactive unit map on our project sites, prospects explore availability and pricing on their own, and they book a tour on the unit they actually want. It has made our sales and leasing far more efficient, and our sites finally feel as modern as the buildings we are selling."
Kirian Betts, Marketing Manager


Check out all the features


